Corrections:
Correction: Metabolic pathway for the universal fluorescent recognition of tumor cells
Metrics: PDF 899 views | ?
1 Department of Physical Chemistry and EMaS, Universitat Rovira i Virgili, Tarragona, Spain
2 Karolinska Institutet, Stockholm, Sweden
3 Philipps-Universität Marburg, Fachbereich Physik, Marburg, Germany
4 Department of Medical Oncology, Hospital Universitario HM Torrelodones, Torrelodones, Madrid, Spain
5 ICREA, Barcelona, Spain
* These authors have contributed equally to this work
Published: November 12, 2019
This article has been corrected: Due to errors in figure preparation, panels A and B of Figure 4 were accidentally duplicated. The corrected Figure 4 is shown below. The authors declare that these corrections do not change the results or conclusions of this paper.
Original article: Oncotarget. 2017; 8:76108–76115. DOI: https://doi.org/10.18632/oncotarget.18551.
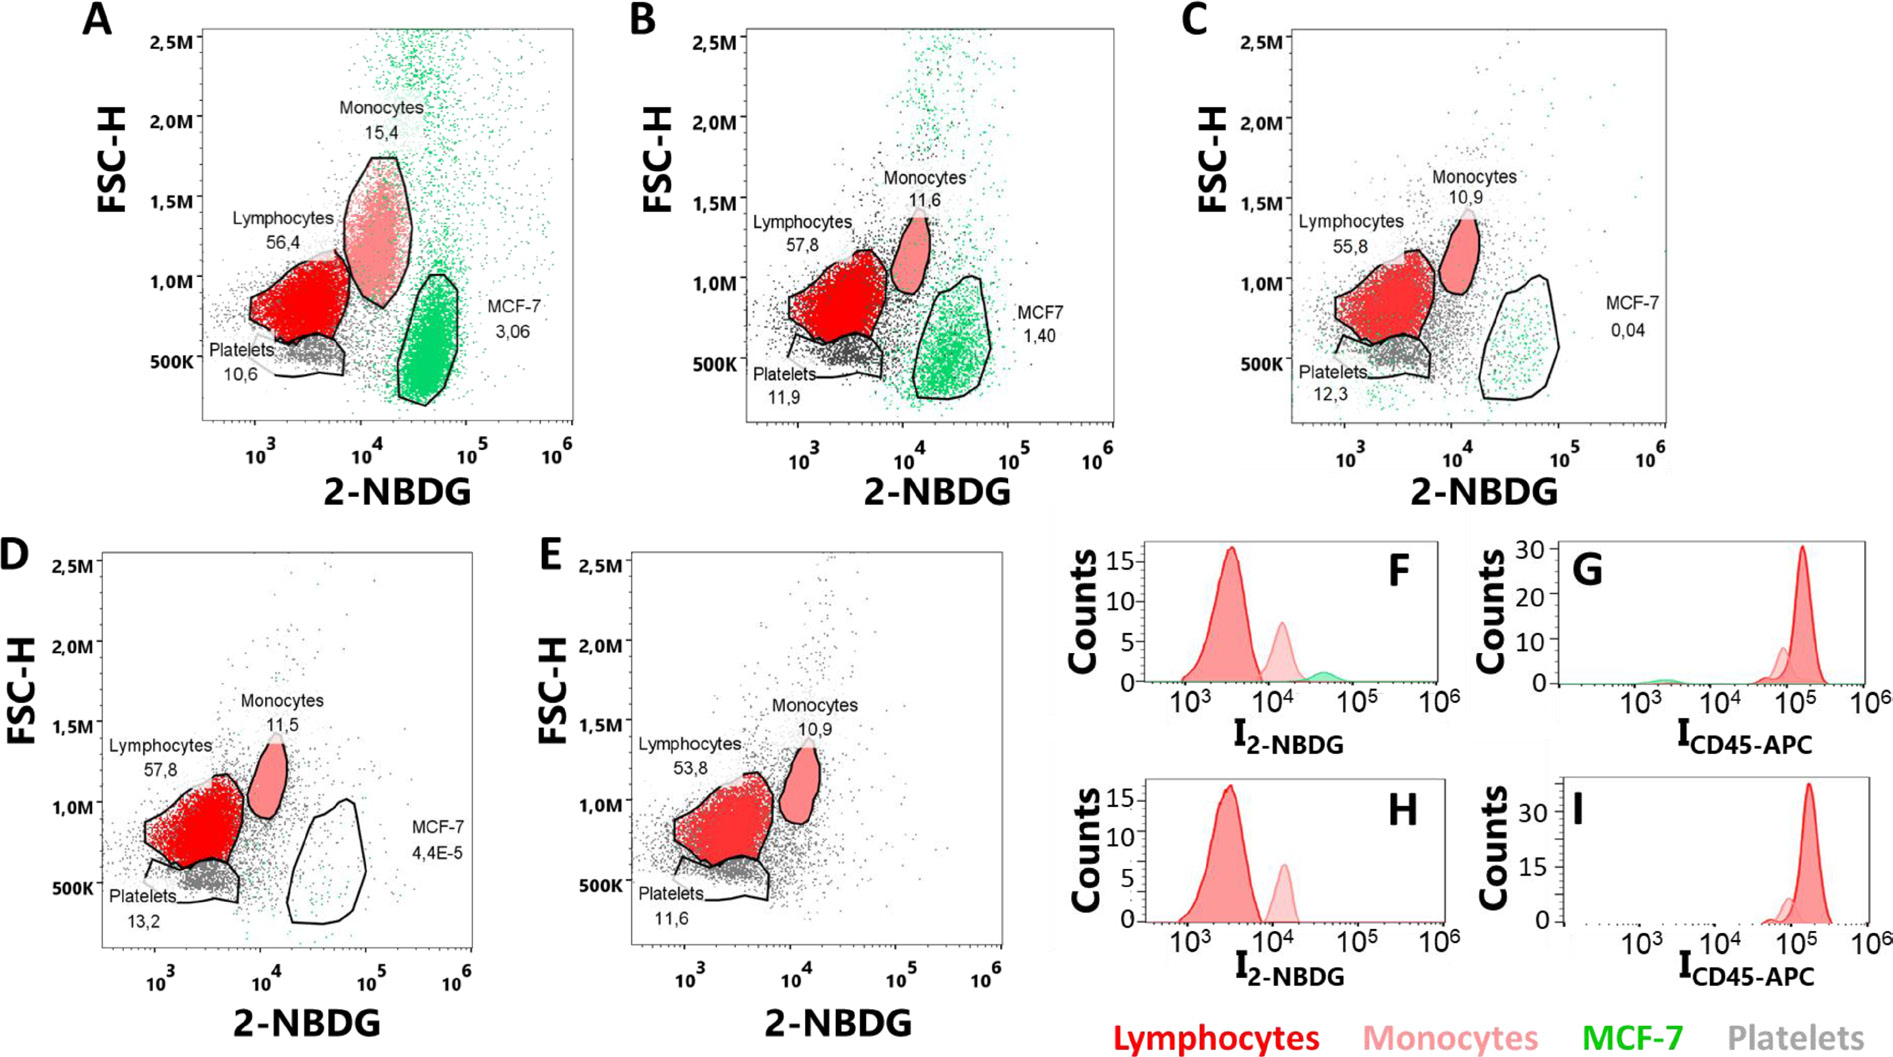
Figure 4: (A–E) Flow cytometry plots of MCF-7 and PBMCs samples with cell ratios (A) 1:10, (B) 1:100, (C) 1:1000, (D) 1:10000 and (E) only PBMCs; upon incubation with 2-NBDG and CD45-APC for 30 minutes under hyperoxia conditions. (F–I) Distributions of fluorescence intensities for (F) 2-NBDG and (G) CD45-APC, in a sample with a 1:1000 MCF-7:PBMC ratio; and (H) 2-NBDG and (I) CD45-APC, in a sample of PBMC. Over 106 single-cell events were collected for each experiment.
 All site content, except where otherwise noted, is licensed under a Creative Commons Attribution 4.0 License.
PII: 27314